Classify the drop
Write down whether the drop appears during a new area, a shader-heavy effect, a busy scene, a menu transition or every second. The timing tells you which layer to test.
Performance troubleshooting guide
Ryujinx FPS drops can come from shader compilation, a graphics backend, resolution scale, a driver, power limits or a Canary regression. Start with one scene, keep the profile fixed, and use the result to choose the next check before changing settings.
$ symptom: find the exact scene
$ baseline: default profile
$ change: one variable
$ result: keep or roll back
This guide does not promise a universal FPS number. Results depend on the game, build, hardware and driver.
Write down whether the drop appears during a new area, a shader-heavy effect, a busy scene, a menu transition or every second. The timing tells you which layer to test.
Use the same Canary build, game update, save point, resolution scale, backend and controller. Start with the emulator defaults and native scale.
Repeat the same route after shaders and persistent translation data have had time to build. A first-run hitch is not the same as a permanent low frame rate.
Update the GPU driver, try Vulkan where it is supported, and compare OpenGL only after recording the baseline. Keep resolution and mods unchanged.
If the result becomes worse, restore the previous value before trying another setting. This keeps the cause visible and protects a working profile.
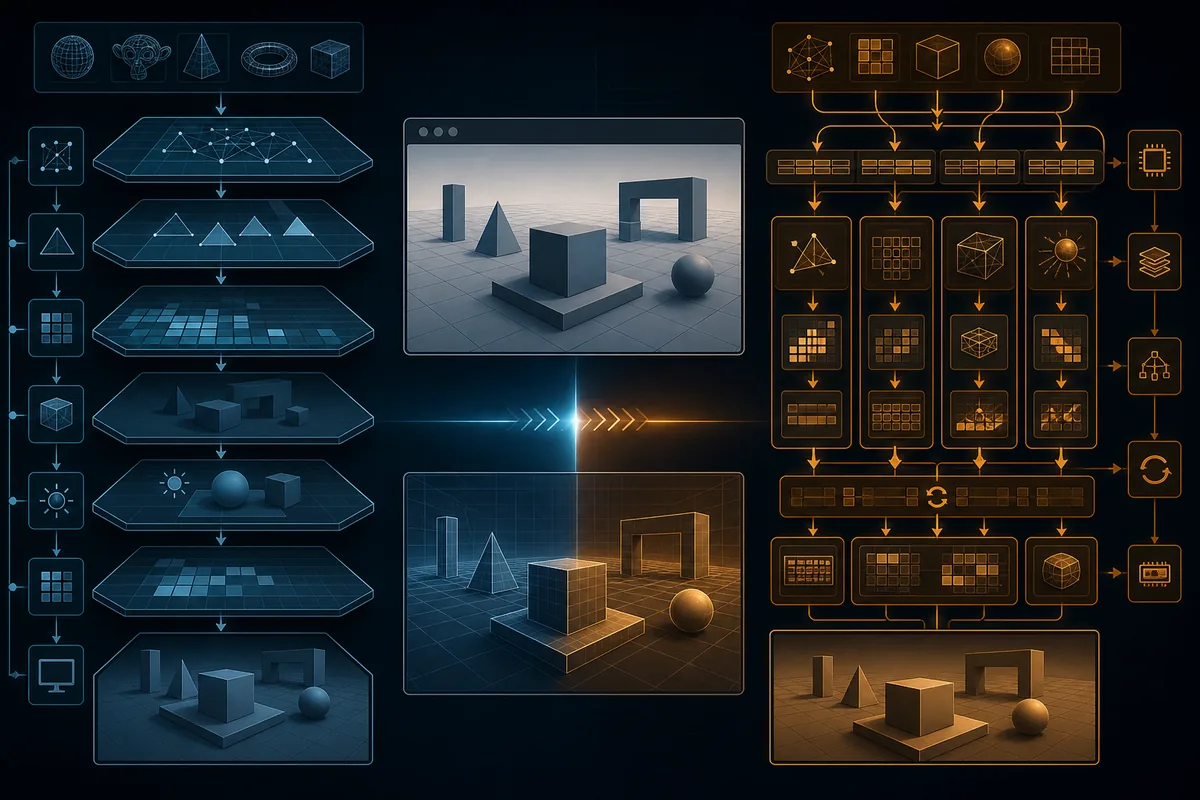
This existing site illustration explains a controlled backend comparison. It is not a benchmark or a real Ryujinx screenshot.
Start at native resolution with the default profile, close background work, and confirm that the GPU driver is current. Run the same scene twice before deciding that the emulator has a permanent FPS problem. A drop only when new effects appear often points to shader compilation. A drop in every scene calls for a CPU/GPU load, power, backend and scale check. If it began after a Canary update, compare the previous working build first.
A sudden dip when entering a new area often follows shader compilation or asset loading. A steady low frame rate in the same scene points more toward CPU/GPU limits, a high scale, a frame cap or a demanding game. Uneven pacing can feel like an FPS drop even when the counter is unchanged. A drop after an emulator, driver or game update deserves a version comparison. Record the scene, duration, audio behavior and whether the issue repeats after a restart.
| Observed pattern | First hypothesis | Next controlled check |
|---|---|---|
| One hitch when a new effect appears | Shader compilation or cache warm-up | Repeat the same route after the first pass |
| Low FPS in every scene | CPU/GPU headroom, scale or power limit | Return to native scale and inspect system load |
| Only Vulkan or OpenGL shows the drop | Backend or driver behavior | A/B test the other backend with the same profile |
| Started after a Canary update | Build regression or changed defaults | Compare the previous working build |
Choose a short route that reliably exposes the problem: a busy town, a combat effect, a camera pan or the same loading transition. Record the build, game update, backend, scale, VSync, mods and power profile. Run it once for a baseline, then repeat it unchanged. Next, change exactly one variable, such as native scale, Vulkan versus OpenGL or a driver version. Compare smoothness, pacing, visual errors, fan behavior and audio, and keep the change only when the repeatable result improves.
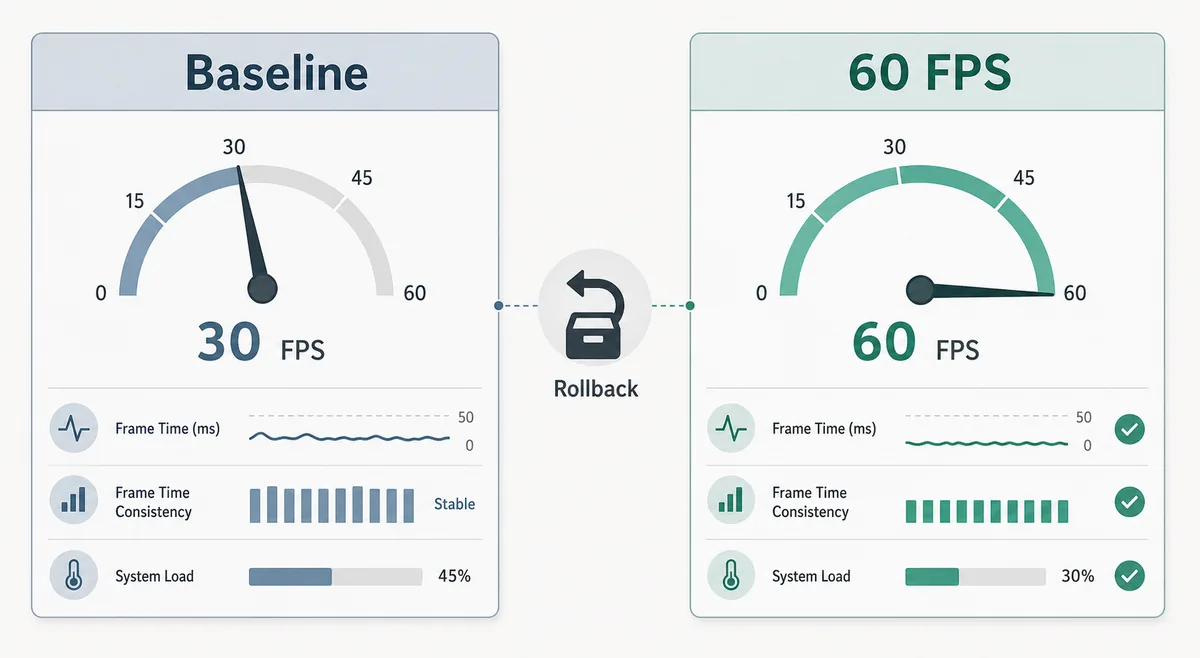
Use the smallest change that answers the question. Native resolution is the cleanest baseline because it reduces GPU work. If the game is stable, test 2x scale only when the GPU has headroom; higher scale can turn a small drop into constant low FPS. Vulkan is a sensible first test on supported drivers, while OpenGL remains a fallback for Vulkan-specific artifacts, freezes or crashes. Keep VSync, filtering and post-processing unchanged until the backend and scale are settled.
| Variable | Safer first value | What the result tells you |
|---|---|---|
| Resolution scale | Native 1x | Whether GPU pixel load is the bottleneck |
| Graphics backend | Vulkan when supported | Whether a driver path changes pacing or stability |
| VSync or frame cap | Keep the baseline value | Whether pacing, not raw FPS, is the visible issue |
| Per-game mod | Disabled for diagnosis | Whether a title-specific patch is influencing timing |
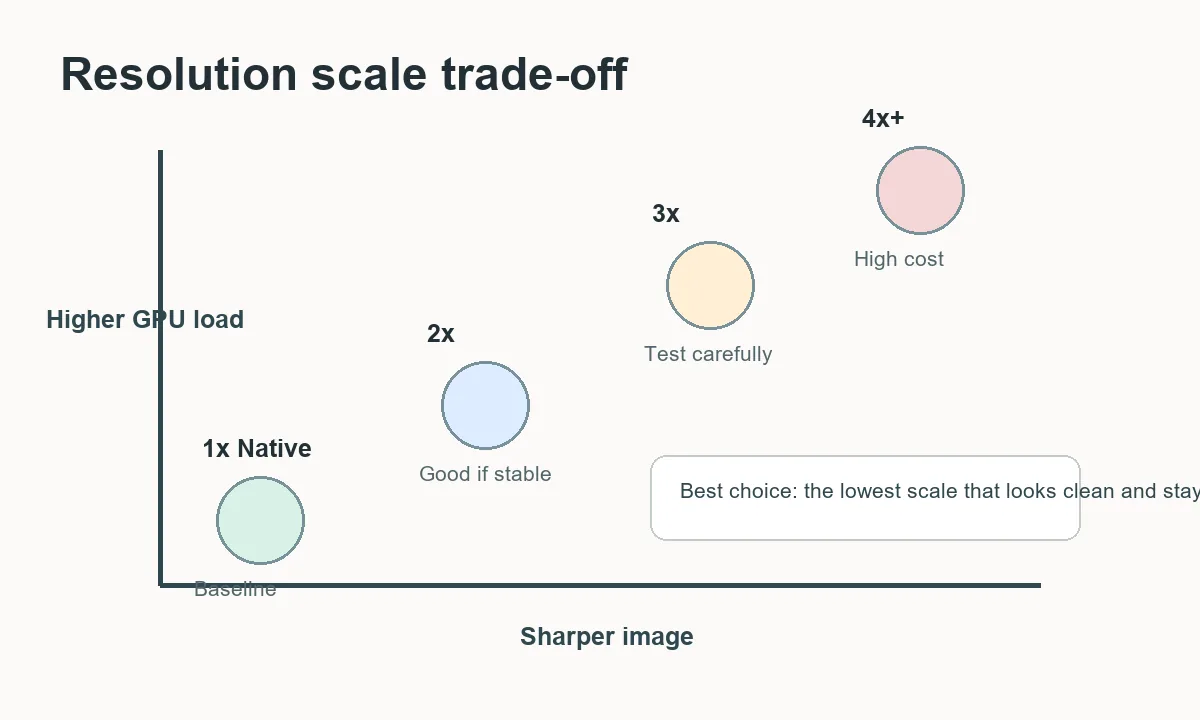
Ryujinx may compile shaders while a game is running, especially when a scene or effect is new. That can create a short hitch that improves after the same content is visited again. Official documentation also describes Profiled Persistent Translation Cache (PPTC), which reduces repeated translation work after earlier launches. Treat the first pass as warm-up, then compare a second or third pass. If the area remains slow after the cache is warm, move to driver, CPU/GPU load, scale and build checks.

A correct emulator setting cannot create hardware headroom. Install a current stable driver and confirm that a laptop uses the intended GPU. A power-saving profile, low battery, thermal throttling or a background encode can reduce clocks. On Steam Deck and Linux, keep the per-game power and refresh profile fixed; on Windows, avoid changing the emulator, driver and power plan together. Watch CPU and GPU utilization if an overlay provides it: low GPU load with low FPS can indicate a CPU or game limit, while a saturated GPU at high scale points toward rendering cost.
Canary builds change quickly, so a new drop can be a regression rather than a setting mistake. Keep the new and previous working builds, use the same game update and save, and test the same scene with the same backend and scale. If only the new build fails, record both versions and the reproduction path. If both fail, look at local configuration, a driver change, a mod, cache state or a title-specific limit. Roll back only the emulator build first.
A troubleshooting sequence cannot make every Switch game reach a target frame rate. Some titles are CPU-heavy, some scenes are limited by emulation accuracy, and some builds or drivers have bugs. A 60 FPS mod changes one game's timing and is not a general performance fix. Missing prod.keys, firmware, updates, DLC, a bad dump or a controller problem belong to separate setup pages. This site does not host copyrighted games, keys, firmware, mods or shader caches. Keep backups and prefer official documentation when a build-specific behavior is unclear.
The workflow follows the official FAQ and setup guidance, while the test matrix is an editorial method for separating causes.
Start at native scale with default settings, update the GPU driver, repeat the same scene after shader warm-up, and test one backend or setting at a time. Keep the change only when the repeatable result improves.
New effects can trigger shader compilation or asset work. Repeat the same route after the first pass. If the hitch remains after the cache is warm, check load, scale, driver and build differences.
Vulkan is a sensible first test on supported current drivers, especially for AMD or Intel hardware according to the official FAQ. It is not guaranteed to be faster for every game; compare the same scene and keep OpenGL as a fallback when it is more stable.
No. A 60 FPS mod changes title-specific timing and needs a matching game update. Diagnose hardware, driver, backend, scale and shader behavior before testing a mod.
The scene may be CPU-limited, frame-capped, waiting on shader or translation work, or limited by the game itself. Compare a warm repeat, keep the cap unchanged, and inspect CPU and GPU behavior together.
Not as a first step. Deleting a healthy cache can create more first-run stutter. Back up the relevant cache and purge only when a repeatable corruption or regression points there.
Run the same scene on the previous working build with the same game update, backend and scale. If only the new build fails, record the versions and reproduction steps before rolling back or reporting the regression.